Blue Bar Chart Shows Increased Profit
Raising Stocks Chart Shows Monetary Growth
Profits Businessman Means Winner Victory And Earning 3d Rendering
Growth File Represents Business Graph And Binder 3d Rendering
Taxes Chart Graph Displays Increasing Tax Or Taxation
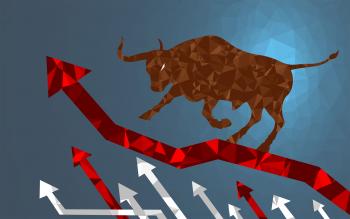
Bull Market - Markets are Climbing
Bear Market - Markets are Falling
Equity markets - Bull versus Bear concept
Bull versus Bear
Paint swatches in shop
Paint samples in the shop
Pyramid With Up Arrows Showing Growth Or Progress
Child Learning On-Line
Connected City - New Trends in Urbanization
Online Shopping Concept - Flat Line Design
Online Shopping - Flat Line Style
Online Shopping - Business to Consumer
Online Shopping - Shopping and Payments Ecosystem
Online Shopping - Laptop to Shopping Cart
Web Page Mock Up - Online Shopping
Shopping with Smartphone
Shopping with Smartphone Flat Design
Online Shopping - Shopping on Desktop
Online Shopping - Shopping Cart on Screen
Online Shopping - Devices and Bags with Copyspace
Email Marketing Concept - With Copyspace
Networking Idea with Lightbulb
Interpersonal Communication Idea with Lightbulbs and Devices
Apps Running in the Cloud
Applications Running in the Digital Cloud - Services in the Cloud
ata Analytics Concept
Online content marketing and web analytics concept
Web analytics concept with data icons
Web analytics concept - Multicolor version
Social media networks on the smartphone
Concept for mobile apps
Mobile communication concept with phone
Touchscreen smartphone with social media icons
Speech bubbles over smartphone
Main social networks connected by a triangle mesh
IT - Information Technology network concept
SEO - Search Engine Optimization concept
Establishing a Client Base On-Line
Data Analytics and Research - Illustration
Big Data Analytics and Research - Dark Background
Big Data Analysis and Research - Concept with Mesh
Online Shopping - Shopping From Home at Your Fingertips
Online Working and Shopping
Internet Banking and Mobile Payments Illustration
Mobile Payments with Biometric ID System
Internet Banking with Smartphone
Vinyl records
Eating well - Healthy italian food ingredients
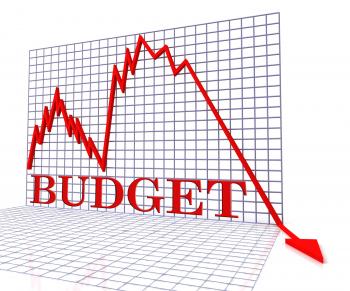
Budget Graph Negative Shows Budgeting Decline 3d Rendering
Arrow Pointing Up On Screen Showing Positive Results
Flow Diagram Represents Charting Organizations And Graph
Blank Diagram Blackboard Shows Business Plan Arrows Flow Chart
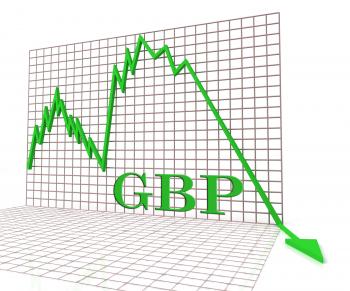
Gbp Graph Negative Shows British Pound 3d Rendering
The Stock Market Game - Bulls and Bears
Money in a pile of coins with financial graph
Money with financial graph - Money and markets concept
Pen on paper with blue arrows - Office work concept
Pen on paper with red arrows - Office work concept
World map on 3D background
Concept of Search Engine Optimization with SEO icons
Concept of Search Engine Optimization
Data Graphs Means Statistical Diagram And Bytes
Cybersecurity in the cloud - Online security concept
Thought process - Finding a solution to a problem
Puzzle in a lightbulb - Problem solving concept
Debt Businessman Shows Lack Of Success And Accounting 3d Rendering
Cloud storage concept
Beating the Street - Or how to make money in stocks
The incredible mighty dollar
The incredible shrinking dollar
Social media marketing concept
Main social media brands - Illustration
Dance Music Charts Means Sound Tracks And Disco
Revenues Charts Represents Business Graph And Salary
Statistics Data Indicates Stats Bytes And Reports
World map with modern triangle pattern
Analyzing a Pie Chart
City of London with Financial Graph
Social Networks Idea with Lightbulb
Simple Digital Cloud Concept
The Internet of Things
Detailed world map with modern triangle
Digital Cloud Concept with Lightning
Simple Connected Cloud
Finance graph on Manhattan at night
Finance graph superimposed on Manhattan
Connectivity Idea with Lightbulb
Debt Graph Chart Displays Increasing Financial Indebted
Music Charts Means Best Sellers And Albums
SEO Chart Graph Shows Increase Search Engine Optimization
Flow Diagram Represents Hi Tech And Background
Arrow Pointing Up On Smartphone Showing Progression Report
Blank Output Diagram Shows Schematic Plan Outflow Chart
Stats Puzzle Shows Statistics Reports Or Analysis
Graph On Screen Shows Increase Sales Achievement
Chart Music Indicates Best Sellers And Albums
Reports Dice Represent Reported Information or Articles
Spending Chart Graph Shows Increasing Expenditure Purchasing
Data Charts Indicates Business Graph And Bytes
Pie Chart Indicates Financial Report And Charts
Infographic Computer Indicates Infographics Online And Statistics
Riches Chart Graph Shows Increase Cash Wealth Revenue
Pie Chart Indicates Stat Graphics And Infochart
Pyramid With Up Arrows And Copyspace Showing Growth Or Progress
Earnings Graph Negative Indicates Wage Crisis 3d Rendering
Investment Charts Shows Business Graph And Forecast
Bonus Chart Graph Displays Increase Reward Or Perk
Country Music Charts Shows Best Seller And Audio
Dance Music Charts Means Hit Parade And Disco
Music Charts Shows Sound Tracks And Harmony
Downturn Graph Represents Market Chart And Loss 3d Rendering
Economy Graph Indicates Micro Economics And Charts
Investment Guide Indicates Business Graph And Advise
Salary Chart Graph Displays Increase Earn Cash Wealth Revenue
Financial Charts Shows Business Graph And Banking
Forex Graph Means Foreign Currency And Exchange
Hand Touch Touchscreen On World Map Shows Internet Web
Sales Chart Graph Displays Increasing Profits Trade
Music Charts Shows Sound Tracks And Harmonies
Credit Graph Chart Displays Buy Increase Grow Debt
Data Charts Represents Web Site And Facts
Investment Rates Represents Invested Percent And Percentage
Hand Touch Touchscreen On World Map Shows Internet WWW
Earn Graph Chart Shows Increase Earnings Growing
Blue Graph Shows Sales Or Profit
Arrow Pointing Up On Screen Shows Successful Sales
Line Over Bar Chart Shows Profit Follows Budget
Save Chart Graph Displays Increasing Savings Investment
Colorful Diagram With Four Arrows Showing Process Or Illustration
Network - Cloud Computing
Network - Cloud Computing - Inverted
Markets Graph Negative Indicates Investments Down 3d Rendering
Chart Music Represents Sound Track And Charts
Pie Chart Shows Business Graph And Charting
Arrow Going Up On Screen Shows Sudden Growth
Chart Music Represents Top Twenty And Audio
Shares Graph Negative Represents Exchange Funds 3d Rendering
Growing Chart Showing Economy Reports